Page tools:
 Print Page Print Page
 Print All Print All
| ||
DEMOCRACY, GOVERNANCE AND CITIZENSHIP The Democracy, Governance and Citizenship section contains the following sub-topics:
LATEST HIGHLIGHTS Males dominate senior levels in non-public sector employers [Endnote 1] Workplace Gender Equality Agency data for 2013-14 shows that 49% of employees in non-public sector employers were female [Endnote 2]. However, females were increasingly under-represented when moving up the management levels of non-public sector employers. Females represented only:
Male Commonwealth judges/ justices outnumber females by almost 2 to 1 Latest Australian Institute of Judicial Administration data shows that, as at March 2015 there were 100 male Commonwealth judges/ justices and 53 female Commonwealth judges/ justices [Endnote 3]. In 2005, male Commonwealth judges/ justices outnumbered females by a factor of 4 to 1 (101 compared to 26 judges/justices respectively). In 2015, there were 17 (46%) female Judges in the Family Court of Australia. However, there were only 11 (24%) female Federal Court Judges and 2 (29%) female Justices in the High Court of Australia. Between 2002 and 2015, the number of male Judges in the Federal and Family Courts of Australia declined, but the number of female judges remained stable or increased. .GIF) Footnote(s): (a) Reference periods as at October 2006, and March for 2007 to 2015. Source(s): Australasian Institute of Judicial Administration, Judges and Magistrates; Unpublished data, Australasian Institute of Judicial Administration Order of Australia awards: females out-nominated by males, and less likely to be awarded higher level Orders. Nominations Latest data (2015) from the Office of the Official Secretary to the Governor-General shows that only 31% of all nominations for the Order of Australia (General Division) were for females. This was in line with the long term average of 30% for females (between 2001 and 2015).  Nominations (b) in the General Division, 2001 to 2015.GIF) Footnote(s): (a) Includes all levels of the award, that is, Companion of the Order (AC), Officer of the order (AO), Member of the Order (AM), and Medal of the Order (OAM). (b) Nominations considered by the Council for the Order of Australia. See Glossary (Democracy, governance and citizenship) for further information. Awards Although more males receive nominations, in 2015 75% of female nominees and 68% of male nominees received an Order of Australia. This was above the long term average of 63% for females and 57% for males.  Awards Received as a Proportion of Nominations, 2001 to 2015.GIF) Footnote(s): (a) Includes all levels of the award, that is, Companion of the Order (AC), Officer of the order (AO), Member of the Order (AM), and Medal of the Order (OAM). Level of award received There are four award levels to the Order of Australia. They are the Companion (AC), Officer (AO), Member (AM) and Medal (OAM) of the Order. In 2015, 6% of female recipients and 10% of male recipients received a higher level Order (AC or AO). The long term average for higher level Orders was 6% for females and 8% for males. Between 2001 and 2015, the proportion of female recipients receiving a higher level Order rarely equalled or exceeded the proportion of male recipients of a higher level Order.  and Officer (AO) of the Order as a Proportion of all Orders, 2001-2015.GIF) DATA VISUALISATION A visual representation of Federal parliamentarians and ministers, from the Democracy, Governance and Citizenship domain is shown below. Simply go to the graph and click on the 'Play' button to see changes in the data over time. Details of the data used to create the graphs, and the original data sources, can be found in the relevant Data Cubes on the Downloads tab. 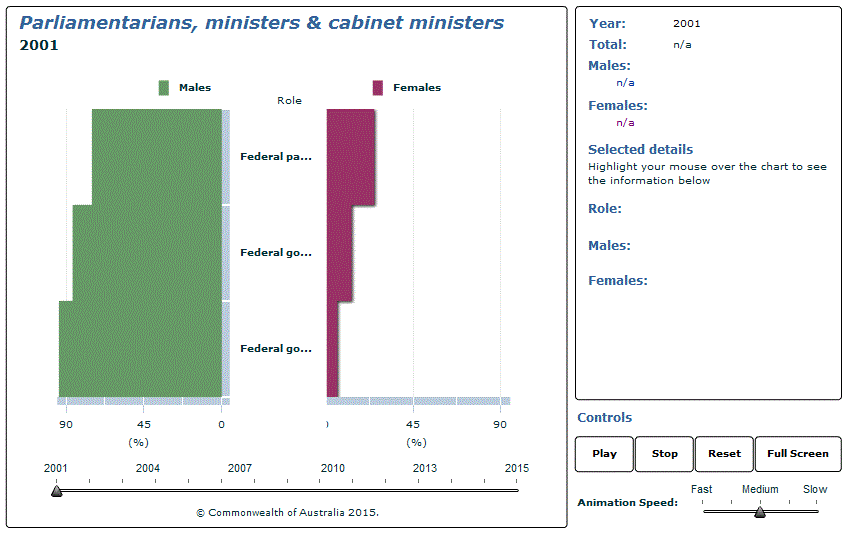 Source(s): Gender Indicators, Australia ENDNOTES 1. Non-public sector employers include any employer that is a natural person, or a body or association (whether incorporated or not) that is not part of the public sector/government, be that federal, state, territory (including state/territory owned organisations/ enterprises), local or an authority. Under the Workplace Gender Equality ACT 2012 (Act), all non-public sector employers with 100 or more employees in Australia for any six months or more of a reporting period are required to report on their gender composition. For more information see Glossary (Democracy, governance and citizenship). 2. Workplace Gender Equality Agency (WGEA), 2014, Australia's Gender Equality Scorecard: Key results from the Workplace Gender Equality Agency's 2013-14 reporting data, November 2014, <www.wgea.gov.au>. 3. Includes the High Court, Federal Court, Family Court and Federal Circuit Court. Document Selection These documents will be presented in a new window.
|
||
4125.0 - Gender Indicators, Australia, Aug 2015
ARCHIVED ISSUE Released at 11:30 AM (CANBERRA TIME) 25/08/2015

This page last updated 22 February 2016